
In this comprehensive guide, you will learn how to calculate Standard Deviation in Excel using the modern functions STDEV.S and STDEV.P, and how to interpret the results to make better decisions.
Are you trying to figure out how consistent your data is? Whether you are a teacher analyzing test scores, a financial analyst looking at stock volatility, or a business owner tracking monthly sales, the Standard Deviation in Excel is the key metric you need.
While the “Average” tells you the middle point, it doesn’t tell the whole story. Two employees could have the same average sales, but one is steady while the other is chaotic. Standard Deviation in Excel reveals this hidden truth.
Calculating this manually involves complex math (square roots and summations). In Excel, it takes about 5 seconds—if you know which formula to choose.
The Formula: Which One Should You Use?
Excel offers two main formulas. Choosing the wrong one is the most common mistake beginners make, and it will give you a mathematical error in your report.
1. STDEV.S (Sample)
- Formula:
=STDEV.S(number1, [number2], ...) - When to use it: Use this when your data represents a sample of a larger population.
- Example: You survey 50 customers out of 10,000 to check satisfaction.
- Example: You analyze the test scores of one specific class, not the whole school.
- Verdict: Use this 95% of the time.
2. STDEV.P (Population)
- Formula:
=STDEV.P(number1, [number2], ...) - When to use it: Use this ONLY when you have data for the entire population (every single data point that exists).
- Example: You are analyzing the exact salaries of all 10 employees in your small company.
- Verdict: Rarely used in day-to-day analysis unless you have 100% of the data.
Step-by-Step How to Calculate Standard Deviation in Excel Guide
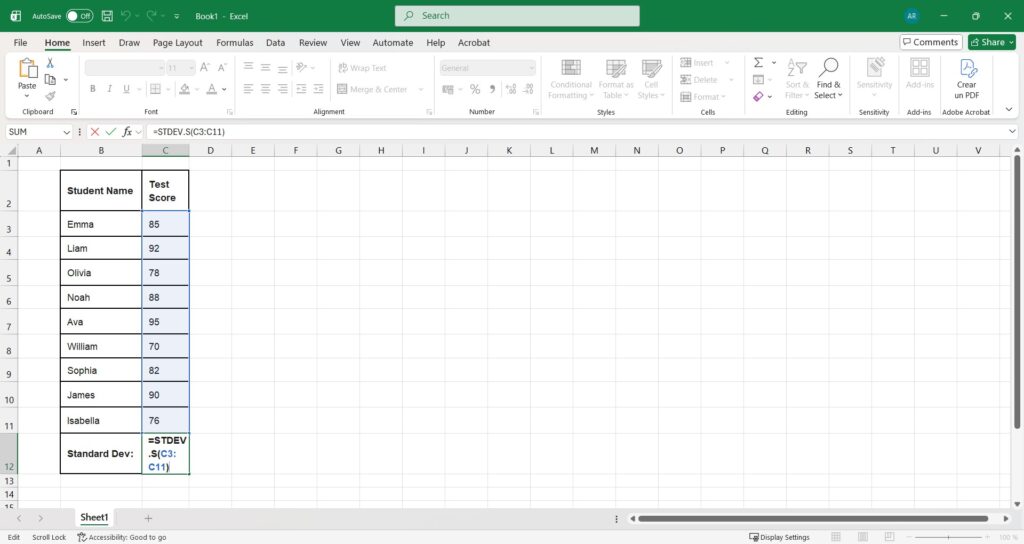
Let’s imagine you are a teacher with a list of student test scores, and you want to know if the class performance was consistent or if there was a huge gap between students.
Step 1: Enter Your Data Type your data into a single column. For this example, we will use cells B3 to B12.
Step 2: Select a Cell for the Result Click on an empty cell where you want the answer to appear (e.g., C12).
Step 3: Type the Formula Since we are analyzing a class (a sample of students), we will use the sample formula. Type: =STDEV.S(
Step 4: Select the Range Highlight the cells containing your numbers (C3:C11). The formula should now look like: =STDEV.S(C3:C11)
Step 5: Press Enter Excel will instantly calculate the standard deviation.
Pro Tip: To keep your report clean, use the “Decrease Decimal” button in the Home tab to show only 2 decimal places (e.g., 15.42 instead of 15.428571).
Real-World Examples: Why This Matters
Why should you care if the Standard Deviation is high or low?
- Scenario A (Low Deviation): A factory produces screws that must be exactly 5cm long. A low standard deviation means all screws are almost identical (High Quality).
- Scenario B (High Deviation): A stock has a high standard deviation. This means the price jumps up and down wildly. It is a “High Risk” investment.
Visualizing these outliers is often the next step. You can use [Conditional Formatting in Excel] to automatically highlight any value that is far from the average (e.g., 2 standard deviations away).
Deep Dive: The Math Behind the Magic
For those who want to understand the engine under the hood, Standard Deviation is mathematically defined as the square root of the Variance.
While Standard Deviation is easier to interpret (because it is in the same units as your data, like “dollars” or “points”), Variance is the statistical foundation.
👉 Want to learn more? Check out our guide on How to Calculate Variance in Excel.
Frequently Asked Questions (FAQ)
What happened to the old STDEV function? You might see a function called simply STDEV (without the dot). This is an older, “legacy” function from Excel 2007. It still works for compatibility, but Microsoft officially recommends using STDEV.S for better accuracy. You can read more about the function specifics on the official Microsoft Support page.
Why am I getting a #DIV/0! error? This error happens if your range contains fewer than two numbers. Standard deviation requires comparing at least two data points to measure the “distance” between them.
How do I interpret the result?
- High Result: Data points are spread far apart (Volatile).
- Low Result: Data points are clustered close to the average (Predictable).
Thanks! It help me out with my exam, tysm
Pingback: How to Remove Duplicates in Excel Fastest Method – ExcelifyHub
Pingback: How to Do Subscript and Superscript in Excel (Shortcuts & Guide) – ExcelifyHub
Pingback: How to Create a Scatter Plot in Excel & Add a Trendline (2025 Guide) – ExcelifyHub
Pingback: How to Calculate Variance in Excel (VAR.S vs. VAR.P Guide) – ExcelifyHub
Pingback: How to Easily Add Subscript and Superscript in Excel 2025