
Understanding data variability is crucial for data analysts, students, and business managers. While the Average gives you the central value, the Variance tells you how spread out your data is.
Calculating variance manually involves complex mathematical formulas (sum of squared differences). It is slow and prone to errors.
Fortunately, Excel can calculate it instantly.
In this guide, you will learn how to calculate Variance in Excel using the two main functions: VAR.S and VAR.P, and understand exactly which one you should choose.
What is Variance? (In Simple Terms)
Variance measures how far a set of numbers is spread out from their average value.
- Low Variance: Data points are close to the average (consistent data).
- High Variance: Data points are spread far apart (volatile data).
Note: Variance is the square of the Standard Deviation. This is why they are almost always calculated together.
The Two Formulas: VAR.S vs. VAR.P
Just like with Standard Deviation, Excel offers two versions. Choosing the wrong one will give you an incorrect result.
1. VAR.S (Sample Variance)
- Formula:
=VAR.S(number1, [number2], ...) - When to use it: Use this when your data represents a sample of a larger population.
- Example: You survey 100 customers out of 50,000 to check satisfaction.
- Verdict: This is the most commonly used function (95% of cases).
2. VAR.P (Population Variance)
- Formula:
=VAR.P(number1, [number2], ...) - When to use it: Use this ONLY when you have data for the entire population.
- Example: You are analyzing the salaries of ALL 50 employees in your specific company.
Step-by-Step: How to Calculate Sample Variance
Let’s analyze the variability in monthly sales to see if performance is consistent.
Step 1: Organize your Data Enter your data in a single column (e.g., Column A). Do not include empty cells.
Step 2: Select a Target Cell Click on the cell where you want the result to appear (e.g., E2).
Step 3: Enter the Formula Type =VAR.S(
Step 4: Select the Range Highlight the cells containing your numbers (e.g., C3:C12). The formula should look like: =VAR.S(C3:C12)
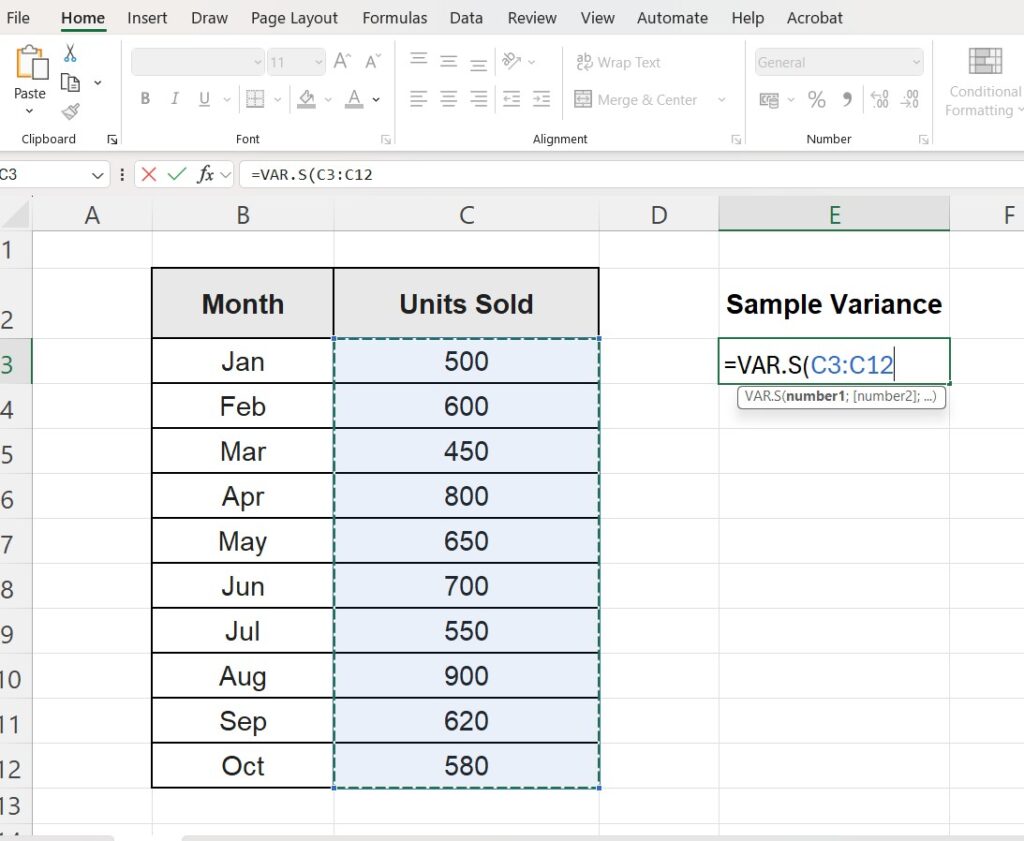
Step 5: Press Enter Excel will return a number. This is your variance.

How to Calculate Population Variance
If you are sure you have the total population data, the process is identical, but the formula changes slightly.
- Select your target cell.
- Type
=VAR.P( - Select your range (C3:C12).
- Press Enter.
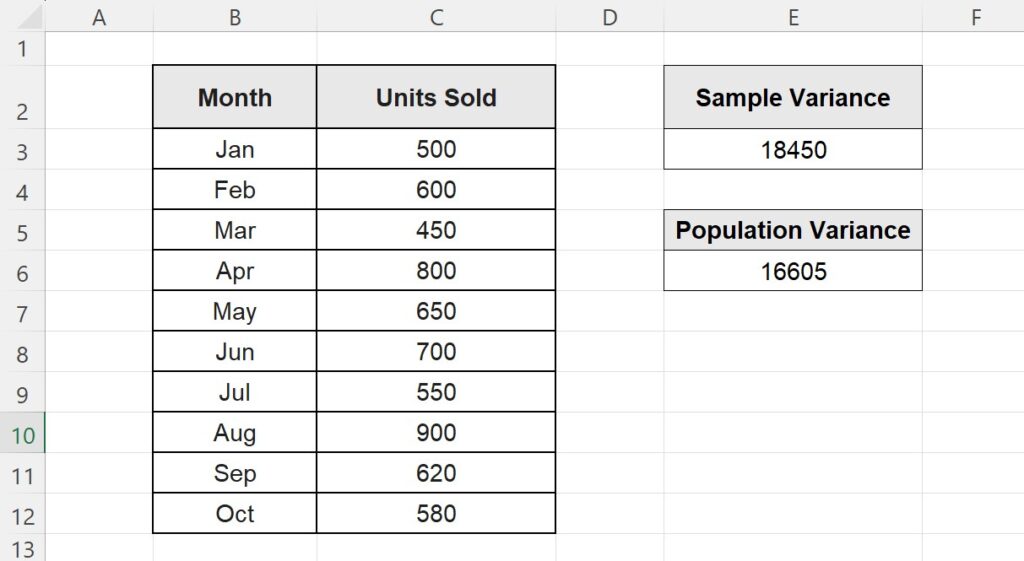
Note: You will notice that VAR.P always returns a slightly smaller number than VAR.S.
Troubleshooting Common Errors
#DIV/0! Error This happens if you use VAR.S with fewer than two numbers. Variance requires comparison between at least two points.
#VALUE! Error This occurs if one of the cells in your selected range contains text instead of numbers. Check your data column for typos.
Formula Error Popup If Excel shows a generic error popup when you press Enter, check your regional settings.
- US/UK: Use commas to separate arguments (
,). - Europe/South America: You might need to use semicolons (
;) depending on your Windows settings.
FAQ: Variance vs. Standard Deviation
What is the difference? Variance is the average of squared differences. Because it is squared, the number can be very large and hard to interpret conceptually.
Standard Deviation is the square root of the Variance. It brings the number back to the same unit as your original data (e.g., dollars or test scores), making it easier to understand.
Next Step: Convert to Standard Deviation Now that you have the Variance, you likely need the Standard Deviation to complete your report.
👉 Read our popular guide on How to Calculate Standard Deviation in Excel.
Pingback: How to Easily Calculate Standard Deviation in Excel (2025)