
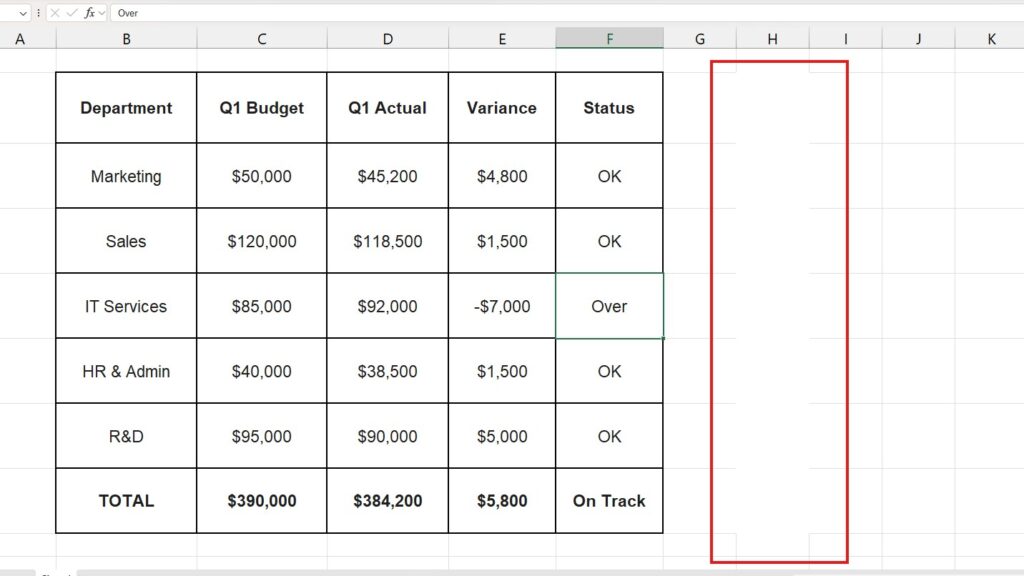
When you open a new Excel workbook, the first thing you see is the faint gray net covering everything. These are gridlines. While they are useful for keeping data aligned during data entry, they are the enemy of clean, professional presentation.
If you have ever looked at a stunning Excel dashboard or a client report and wondered, “Why does this look like an app and mine looks like a spreadsheet?”, the answer is usually simple: they learned how to remove gridlines in Excel.
In this comprehensive guide, we will explore every method to hide these lines—whether you want to toggle them off globally, hide them only in specific areas, or ensure they don’t ruin your printed PDFs.
Method 1: The “View” Tab Toggle (The Fastest Way)
This is the standard method to remove gridlines from the entire worksheet instantly. It is non-destructive and easy to reverse. This is the most common method when learning how to remove gridlines in Excel quickly.
Step-by-Step:
- Open your Excel worksheet.
- Click on the View tab in the top ribbon.
- Look for the Show group (usually near the left-center).
- Uncheck the box labeled Gridlines.
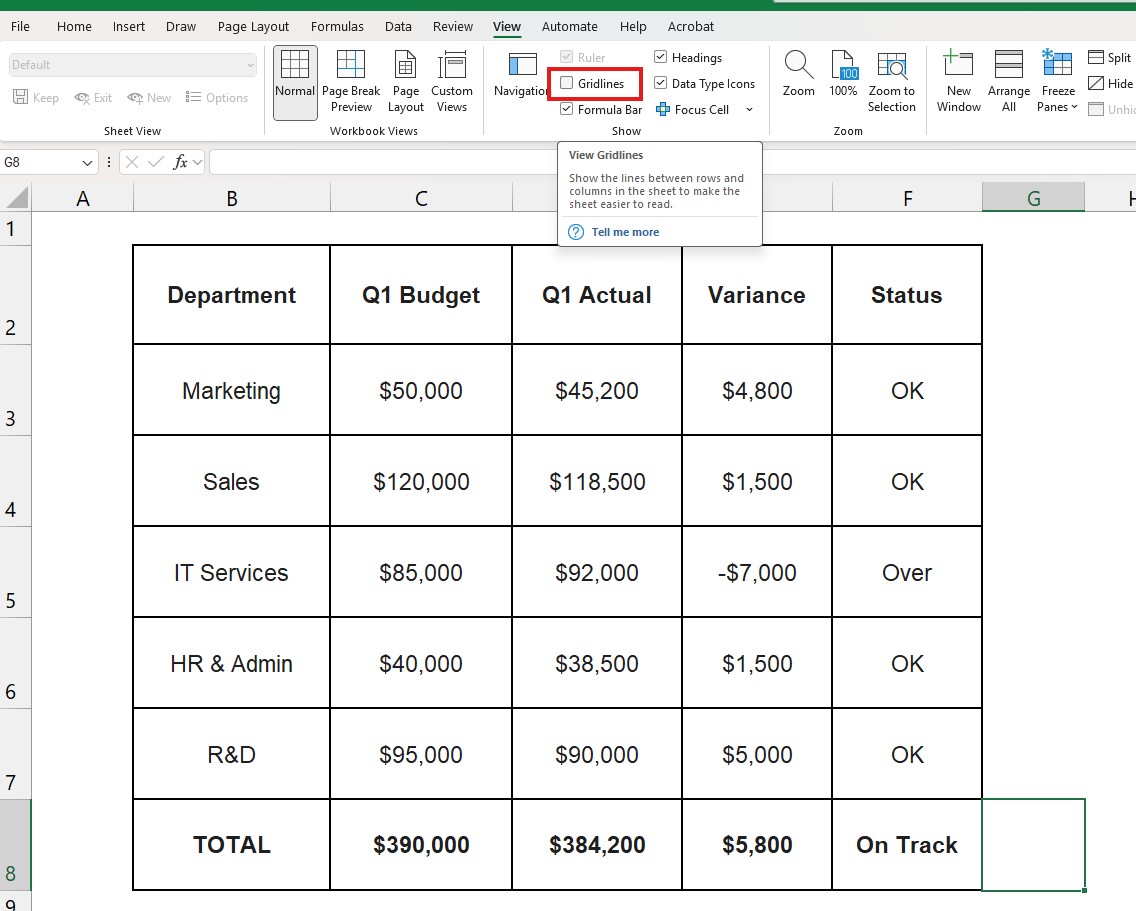
Result: The entire sheet turns into a clean, white canvas. This is the first step in creating any dashboard.
Note: This setting is “per sheet.” If you have multiple tabs, you will need to repeat this process for each one, or select all tabs (hold Ctrl and click the tabs) before unchecking the box.
Method 2: The “Fill Color” Trick (For Specific Areas)
Sometimes, you don’t want to remove gridlines everywhere. Maybe you want to keep the grid for your data table but have a clean white space around it for charts and headers.
The “View” tab is all-or-nothing. To be selective, use Fill Color.
How to do it:
- Select the range of cells where you want to hide the grid (e.g., A1:Z10 for a header area).
- Go to the Home tab.
- Click the Paint Bucket icon (Fill Color).
- Select White (Theme Colors).
Why this works: Excel gridlines are actually behind the cells. By filling the cell with white “paint,” you are covering the gray lines. The lines are still there; they are just hidden behind the color.
Method 3: Changing Gridline Color (The Subtle Approach)
If you find the default gray too harsh but removing it completely makes it hard to read the data, you can change the color to a lighter gray or a faint blue.
- Go to File > Options.
- Click on Advanced in the left menu.
- Scroll down quite a bit until you find the section: Display options for this worksheet.
- Locate Gridline color (there is a small paint bucket icon next to it).
- Choose a very light gray or a custom color.
- Ensure the “Show gridlines” box is checked.
- Click OK.
This is a pro tip for financial modelers who need structure but don’t want the visual noise of the default dark grid.
Troubleshooting: “Why Are My Gridlines Still Visible?”
You followed the steps on how to remove gridlines in Excel, but you still see lines. This is a common confusion between Gridlines and Borders.
The Difference:
- Gridlines: Automatic faint gray lines generated by Excel. They do not print by default.
- Borders: Lines you manually added. They print by default.
The Fix:
- Select the stubborn cells.
- Go to the Home tab.
- Click the arrow next to the Borders icon (looks like a window pane).
- Select No Border.
If the lines disappear now, they were never gridlines to begin with—they were borders someone applied manually.
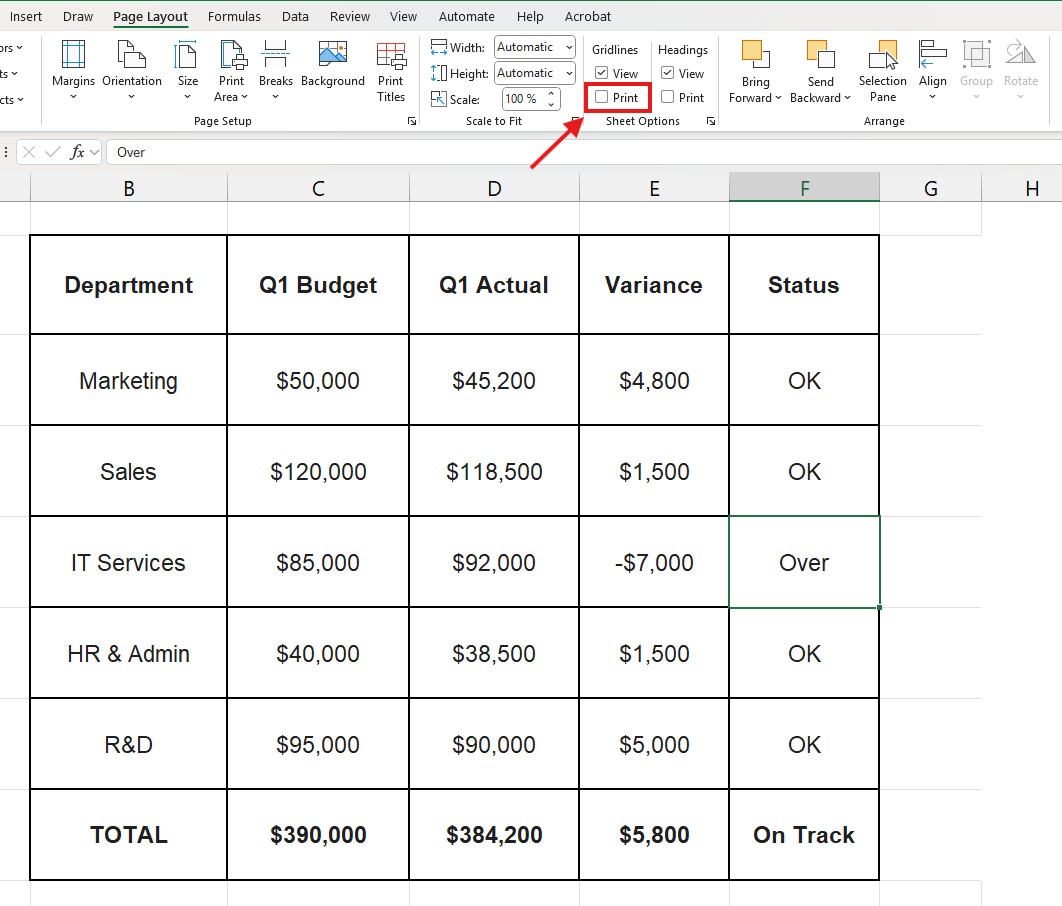
Advanced: How to Handle Gridlines for Printing
A common nightmare: The screen looks clean, but when you print to PDF, the gridlines reappear (or vice versa: you want them to print, but they don’t).
To Ensure Gridlines DO NOT Print:
By default, Excel does not print gridlines. If they are showing up on paper:
- Go to Page Layout.
- Look at the Sheet Options group.
- Under Gridlines, ensure the Print box is unchecked.
To Ensure Gridlines DO Print:
If you are printing a data list and want the lines to help the reader follow the rows:
- Go to Page Layout.
- Under Gridlines, check the Print box.
- Pro Tip: Printed gridlines can look messy. We recommend using Alternating Row Colors instead for better readability.
Best Practices for Dashboard Design
Learning how to remove gridlines in Excel is just the beginning. To make your spreadsheet look like professional software:
- Remove Gridlines: Step 1 (as we learned).
- Use Soft Backgrounds: Apply a very light gray fill to the whole sheet, and use white fill for your “Cards” or charts. This creates a “shadow” effect.
- Hide Headings: Go to View and uncheck Headings to hide the “A, B, C” and “1, 2, 3” labels. This removes the “spreadsheet look” entirely.
Frequently Asked Questions (FAQ)
Does removing gridlines affect file size? No. Toggling the “View” setting changes nothing in the file size. However, using Method 2 (filling thousands of cells with white color) can slightly increase file size if applied to millions of empty rows. Use the View tab method whenever possible.
Can I set “No Gridlines” as the default for new files? Excel doesn’t have a simple “default” switch for this. You would need to create a custom template (Book.xltx) saved without gridlines and set it as your startup file.
Why is the “Gridlines” box grayed out? If you cannot click the checkbox, you might be in “Layout View” or have multiple sheets grouped. Try clicking on a single cell and ensuring you are in Normal View (View tab > Normal).
Conclusion
A messy spreadsheet distracts from the data. By mastering how to remove gridlines in Excel, you take instant control of your visual presentation.
Whether you are preparing a financial report for a stakeholder or a personal planner, turning off those default gray lines is the easiest way to upgrade your work from “Basic” to “Pro”.
Pingback: How to Create Charts in Excel: The Ultimate Guide 2025